Google converted my hand-drawn X-Y chart to an SVG drawing
I needed an X-Y graph plotting temperature against the porosity and firing shrinkage of a porcelain clay body. After fiddling with a spreadsheet, trying to remember how to do it and then wasting time trying to type the data in the way it wanted, I just sketched it on a scrap of paper and gave it to Google Gemini to convert into an SVG file (scalable vector graphic). While it had the x-intercepts perfectly positioned, I was able to select coordinate-pair dots and fine-tune their positions along the y-axis (using Inkscape). Further editing was easy (moving the X-axis title, rotating and moving the line labels, coloring the lines). I then copied the whole graph as a bit image with a transparent background (so it pasted nicely onto this photo).
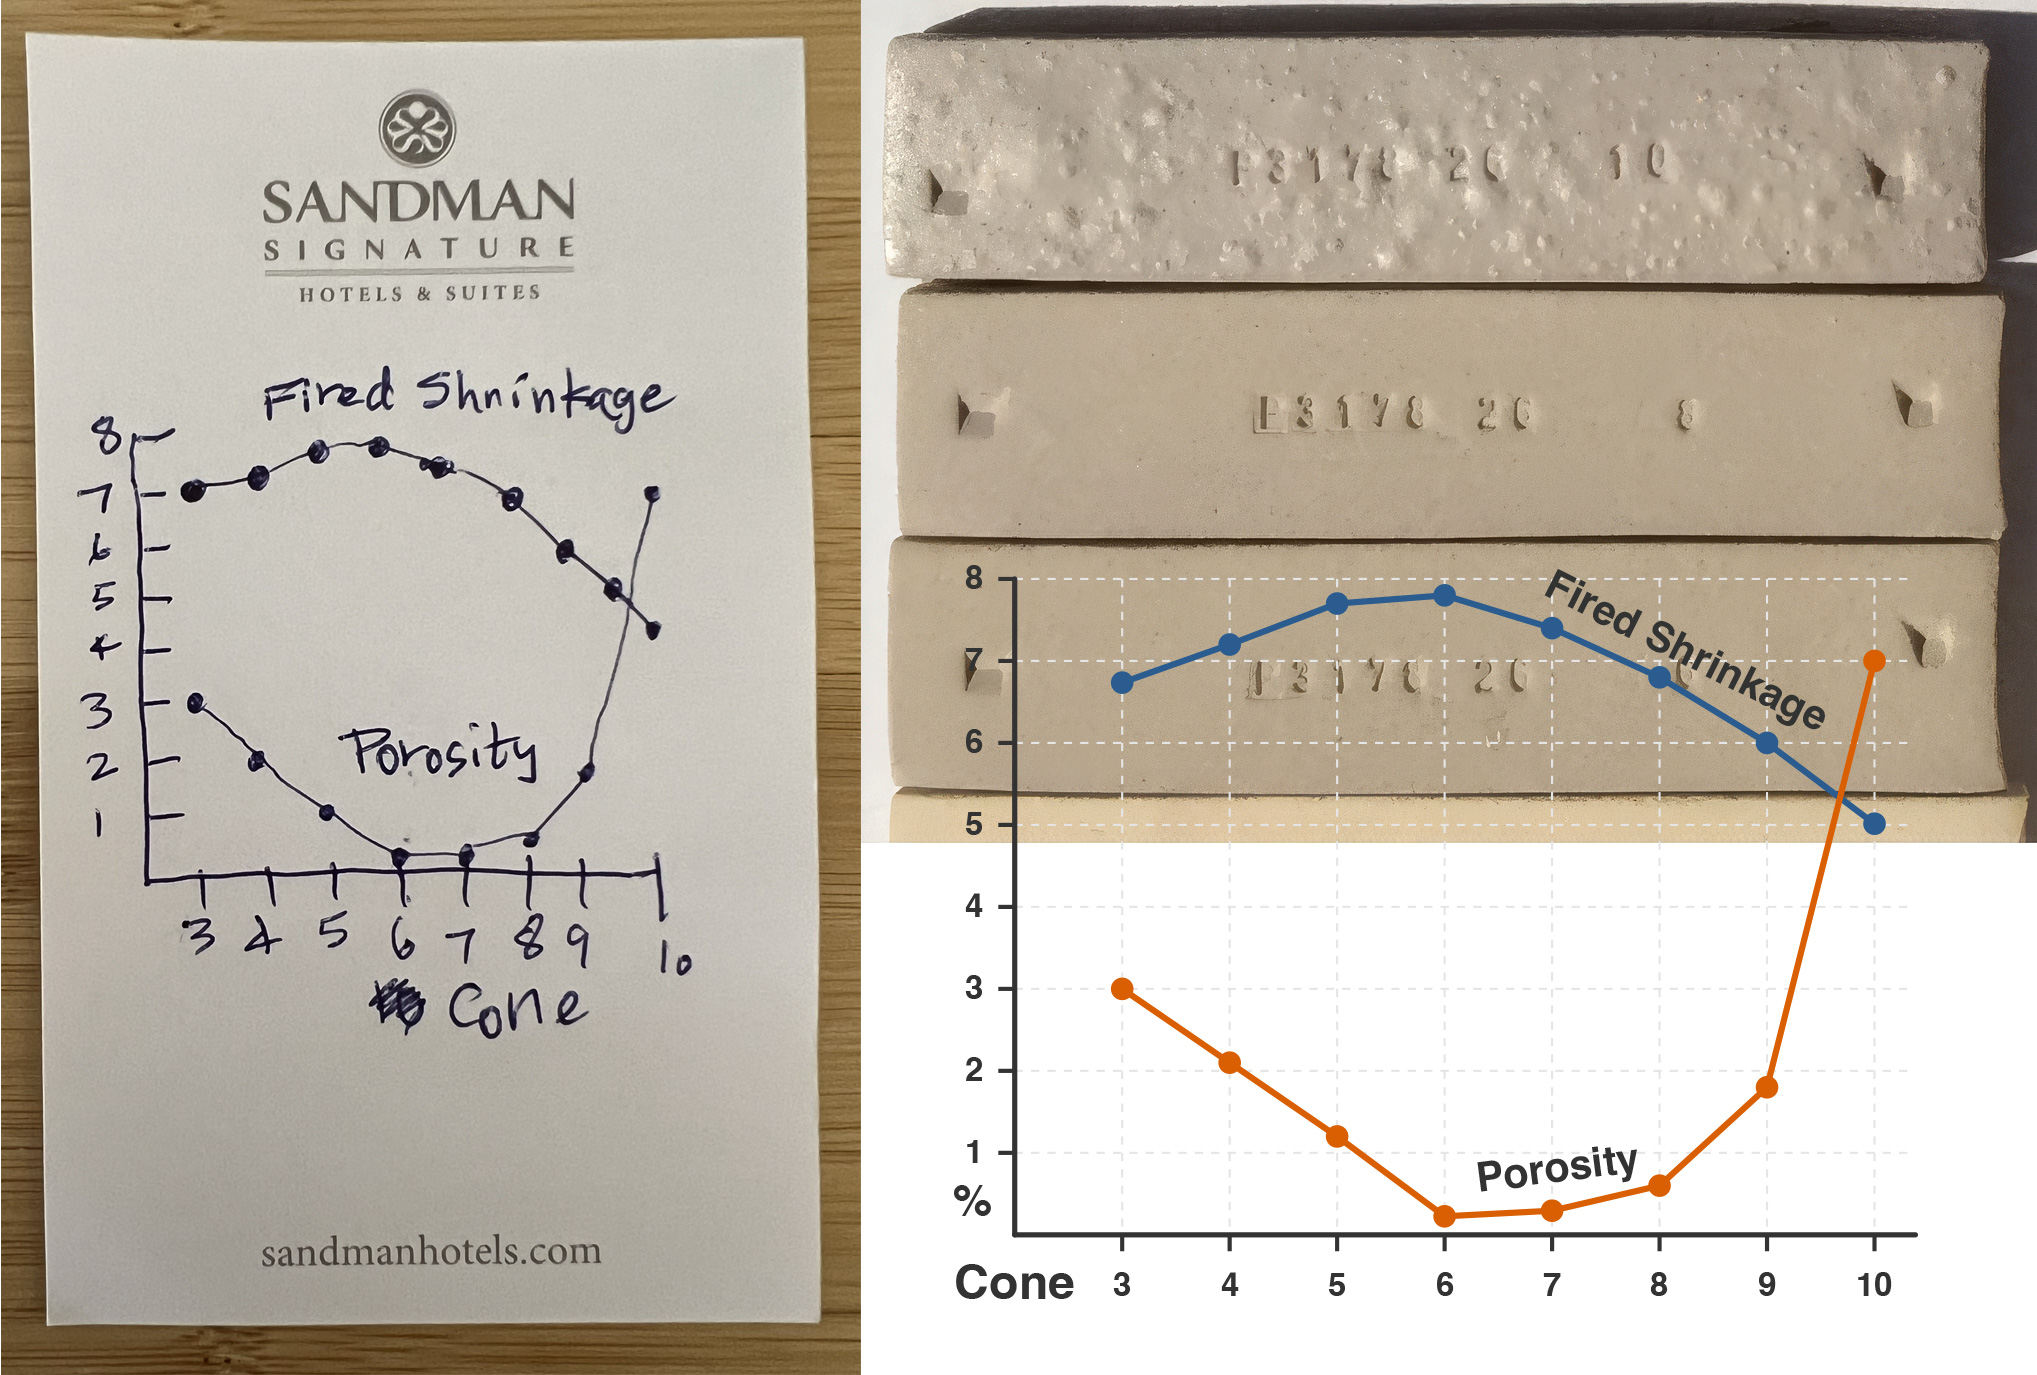
I used Google to convert this hand-drawn X-Y graph into a transparent, scalable vector graphic that could be pasted over this photo. AI Policy
Related Pictures
This bloating is a normal consequence of overfiring
This is how you know it has too much feldspar
This picture has its own page with more detail, click here to see it.
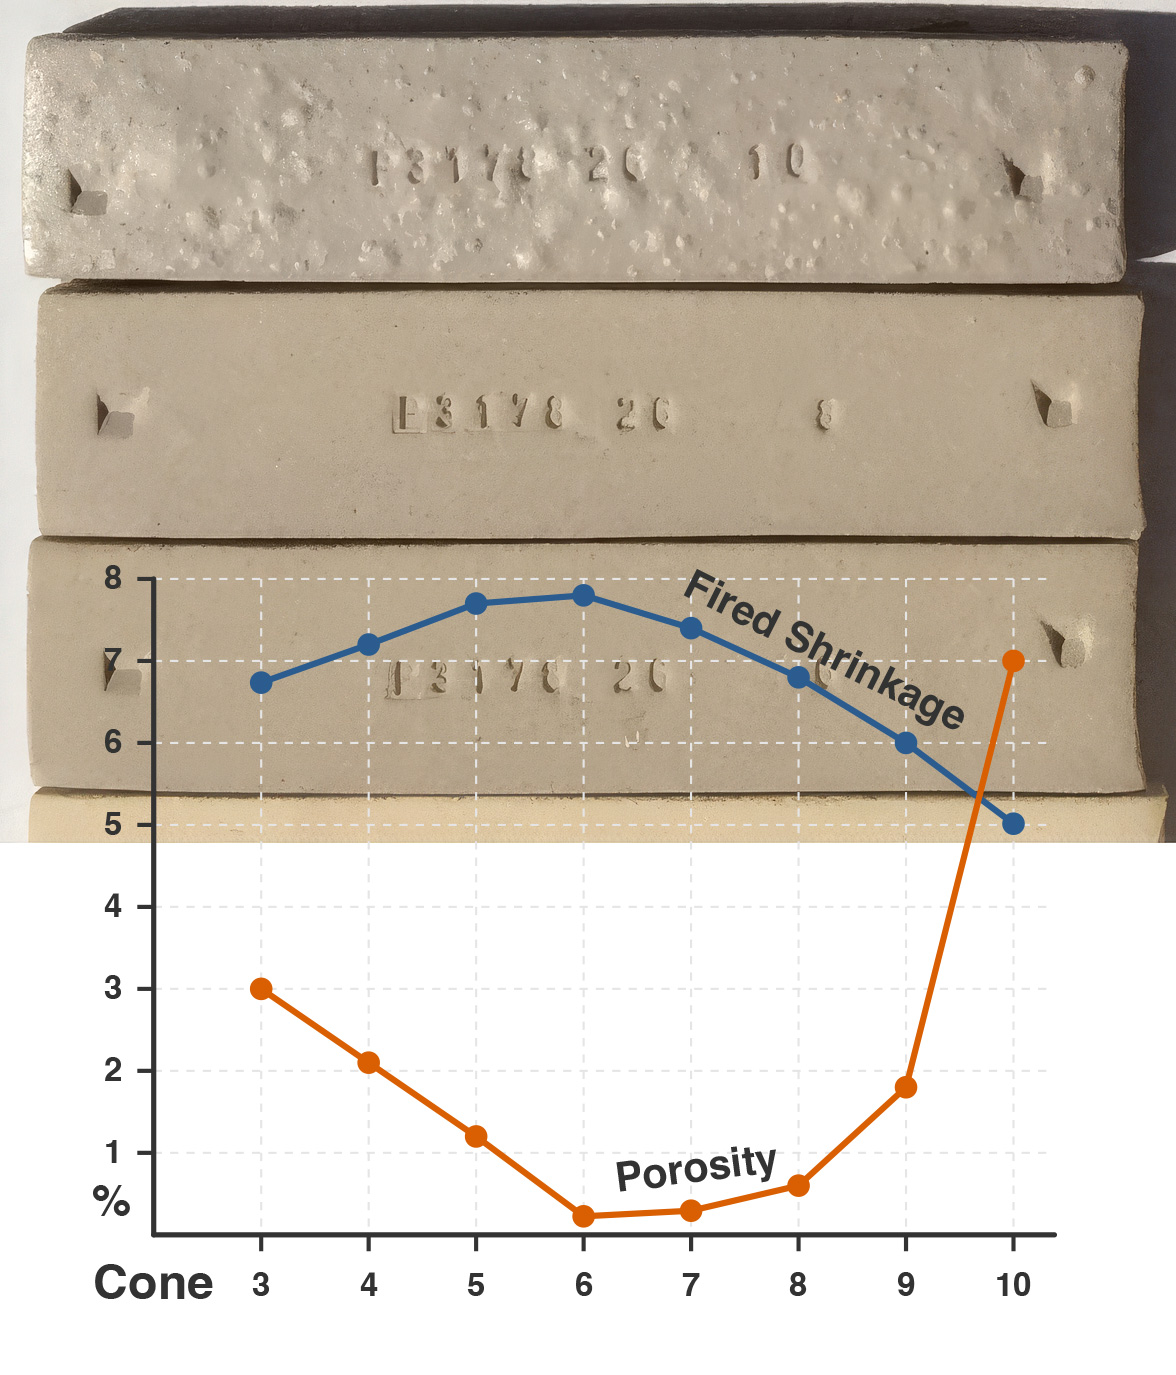
SHAB test bars of a whiteware clay bloating at cone 10 oxidation. While it appears stable at cone 8, it isn't. This is a variation on the 25x4 porcelain recipe. It employs 200 mesh silica, kaolin, ball clay and feldspar. Whiteware bodies like this often soften and melt without ever bloating, but not this one. These fired bars appear to show that this vitrifies at cone 8. However, ware fired at cone 8 exhibits the classic evidence of overfiring: It warps. Overfire it still more, to cone 10, and we enter bloating territory by a new development: The ball clay in the recipe contains soluble salts; these become a thin glaze that glosses and seals the surface, trapping LOI gases which create internal voids (top bar). This line graph shows it as a massive spike in absorption/porosity going into cone 10. It also shows that cone 6, the bottom bar, provides the lowest porosity and highest fired shrinkage, while not being on a volatile part of the curves.
This phenomenon is a reminder that the percentage of feldspar (or feldspar-containing clays) is best tuned such that the body is just reaching (or has just reached) its minimum achievable porosity (assuming it is for functional ware). This can be done by making test bars like this and firing them at a range of temperatures up to and beyond the target to get a broad view of how maturity progresses.
 PayPal | No tracking, No ads, No paywall, No transient content! Just organized, concise information constantly updated and improved. Was this helpful? Consider supporting me. |
Got a Question?
Buy me a coffee and we can talk 

https://digitalfire.com, All Rights Reserved
Privacy Policy